Rejected Events Tab
Rejected Events
The Secure Work application leverages Vision AI to detect objects and scenarios in the workplace. Occasionally, an event may represent a valid exception or a false detection. Supervisors and Operations teams can review the supporting evidence and classify each event as either Accepted or Rejected. This tab provides visibility into all events that have been marked as Rejected, offering insight into potential misclassifications or environmental anomalies.
If events have not been reviewed as noted above, this tab will not contain any data.
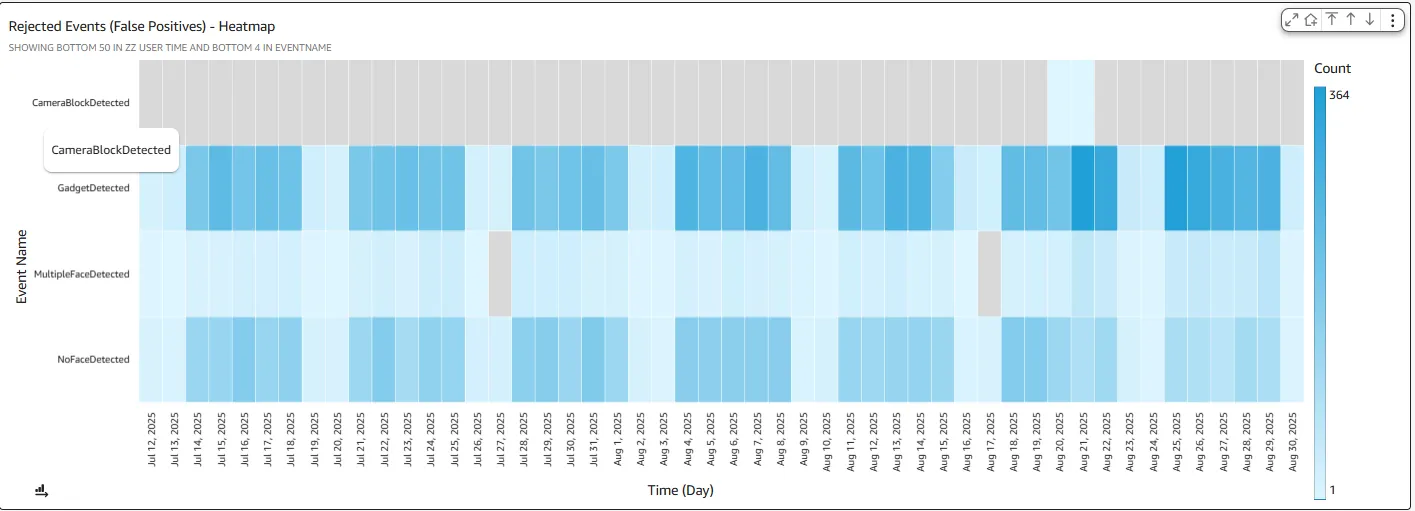
📅 Visual: Rejected Events (False Positives) - Heatmap
Rejected Events is a heatmap that displays rejected event counts over time. The default time scale is set to days, with each column representing a specific date.
Uses
This visual highlights the distribution of rejected events across different time periods. An unusually high count during any specific interval may warrant further investigation through drilldowns. The displayed data reflects the filters and selections applied in the Common Controls.
Drill-downs Supported
- Cell Drill Down - The Event Name and the date/time are passed as filters to the following visuals on this tab.
- Rejected Events (False Positives) - Top 50 Agents - This visual will be updated to show occurrences of the rejected event at the selected time for each agent, showing the Top 50 agents with the most occurrences.
- Time Drill Up/Down - Time-based drill-ups and drill-downs can be accessed via the visual menu located in the top-right corner of the chart.
Tooltips
Tooltips are shown when the cursor is placed on any cell. The information shown includes;
- Date - Date of the event
- Event Name - Showing the name of the event.
- Agents - Name of the agent. If multiple agents, then a '*' is shown
- Count - Count of events in the selected time period
💡 Tip: Since drill-downs filter data across visuals, tooltips help clarify the specific details being displayed.
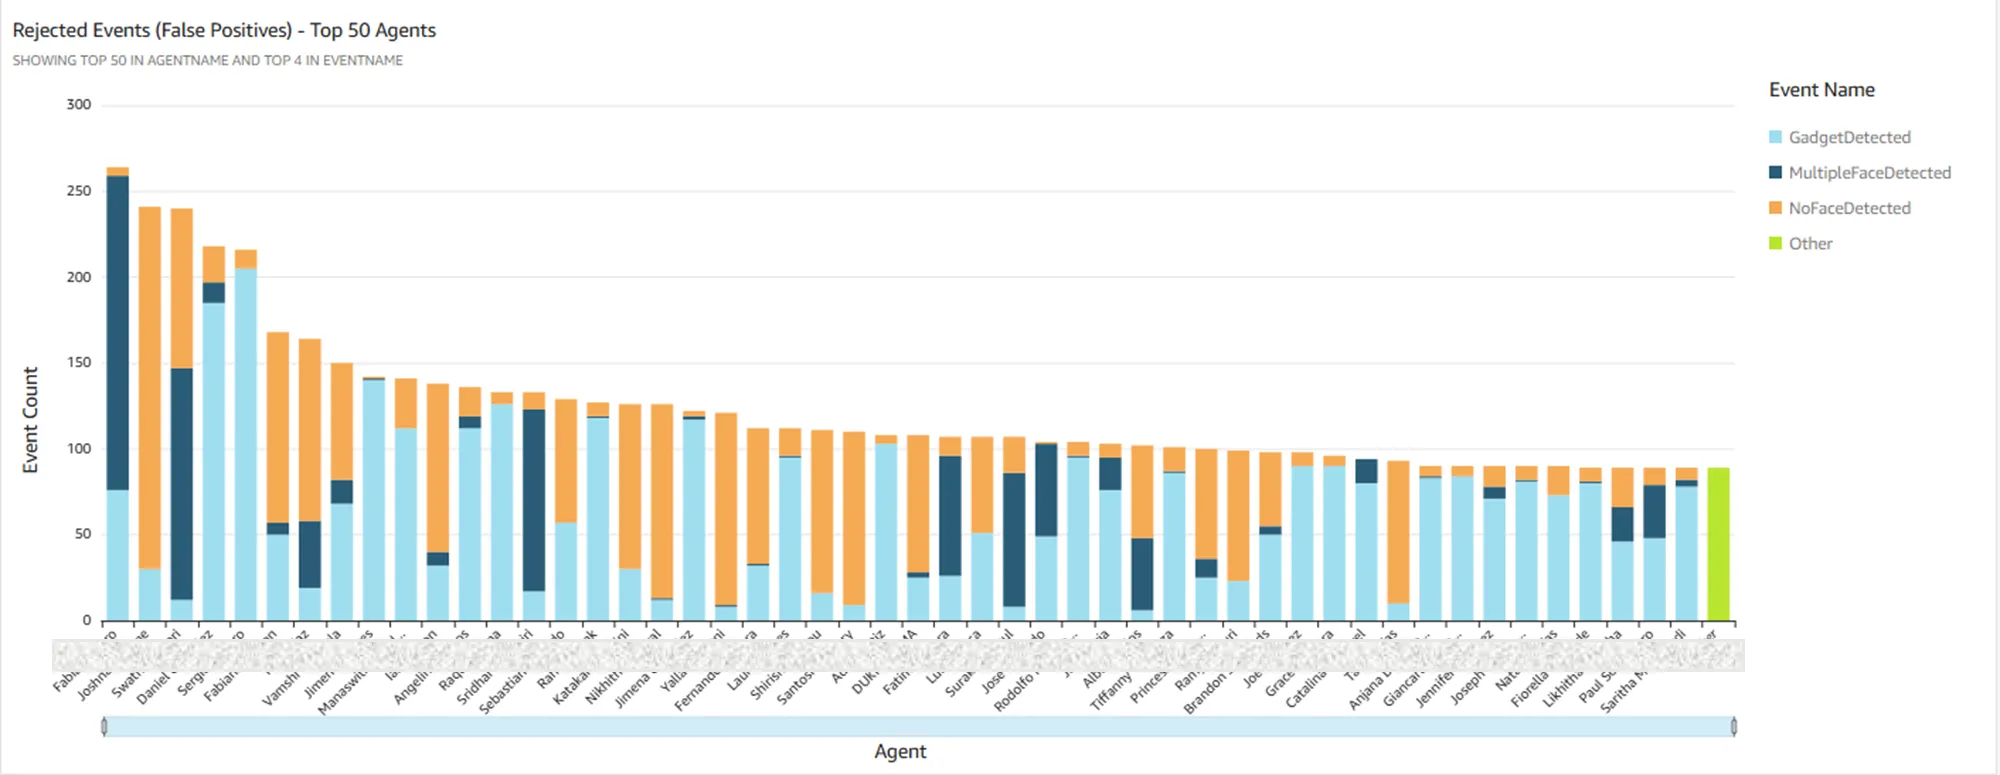
📅 Visual: Rejected Events by Agents (False Positives) - Top 50 Agents
Rejected Events by Agent displays a stacked bar chart showing rejected event counts for agents within the selected time period. If more than 50 agents are selected, only the top 50—based on total event count—are shown. Each bar represents the total number of rejected events for a specific agent, with individual segments color-coded by event type. The length of each segment reflects the count of that event type, and the legend provides a color reference for all event categories.
Uses
This visual helps focus on unusually high rejected event counts for individual agents. For example, does an agent have an unexpectedly high number of rejected GadgetDetected events? This may require a review of the events evidence to understand the cause. This visual can be helpful for spotting potential issues in an agent’s environment or repeated unusual behavior.
💡 Tip: The Rejected Events (False Positives) - Details visual can be used to identify specific events for further investigation.
Drill-downs Supported
- Agent Drill Down - Clicking on any segment of the bar will pass the event and agent name as a filter to the following visuals on this tab.
- Rejected Events By Time - The visual is filtered to display only the events associated with the selected agent and time period. Tooltips reveal the agent’s name for each cell.
- Rejected Events (False Positives) - Details - This table visual is filtered to show each instance of the selected event for the agent.
Tooltips
Tooltips are shown when the cursor is placed on any segment of the bar. The information shown includes;
- Name - Agent name represented by the bar
- Event Name - Showing the name of the event
- Count - Count of events in the selected time period
- Last Event - Shows the last time of occurrence of the event
💡 Tip: Since drill-downs filter data across visuals, tooltips help clarify the specific details being displayed. Note:
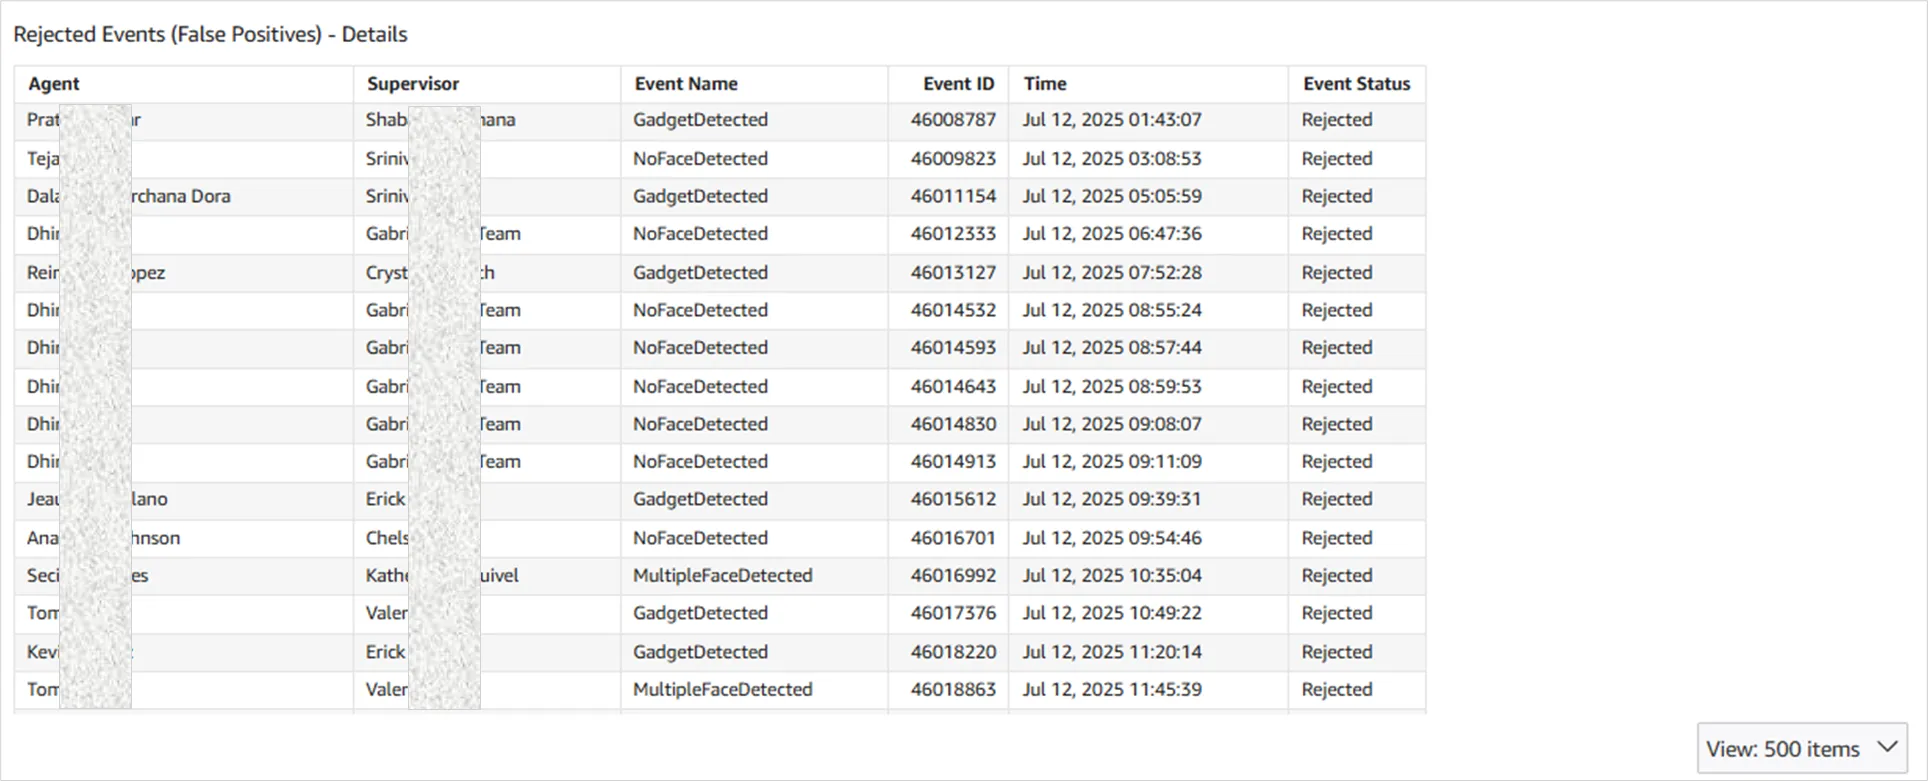
📅 Visual: Rejected Events (False Positives) - Details
Rejected Event - Details visual is a table showing the details for each event. The following columns are shown:
- Agent - The name of the agent
- Supervisor - The name of agent's supervisor
- Event Name - The name of the rejected event
- Event ID - The event ID using which details of this event can be seen in OCM
- Time - Time at which this event occurred
- Event Status - Since this table will only have rejected events, the value in this column will always be "Rejected"
Uses
This visual displays the chronological sequence of rejected events for the selected time period and agents. The table includes key details—such as the Event ID—which can be used to access the full event record in OCM for further review.
💡 Tip: Event details can be exported as a CSV or Excel file using the menu located in the top-right corner of the visual. Note: exports are limited to 100,000 rows.
Drill-downs Supported
- Event Drill Down - Clicking on any cell in the table will pass the event name as a filter to the following visuals on this tab.
- Rejected Events (False Positives) - Heatmap - The visual is filtered to display only the events for the selected time period. Tooltips reveal the agent’s name for each cell.
- Rejected Events for Agents (False Positives) - Top 50 Agents - The visual is filtered to show the occurrence of the event for the selected agents and time period.
Tooltips
Tooltips do not apply to table visuals.