Events Tab
Events
The Secure Work application generates a wide range of event types, including policy violations, system-level activities, and authentication events. The visuals in this tab offer insights into these occurrences, highlighting how different teams and individual users contribute to event patterns over the selected period.
📅 Visual: Events by Time
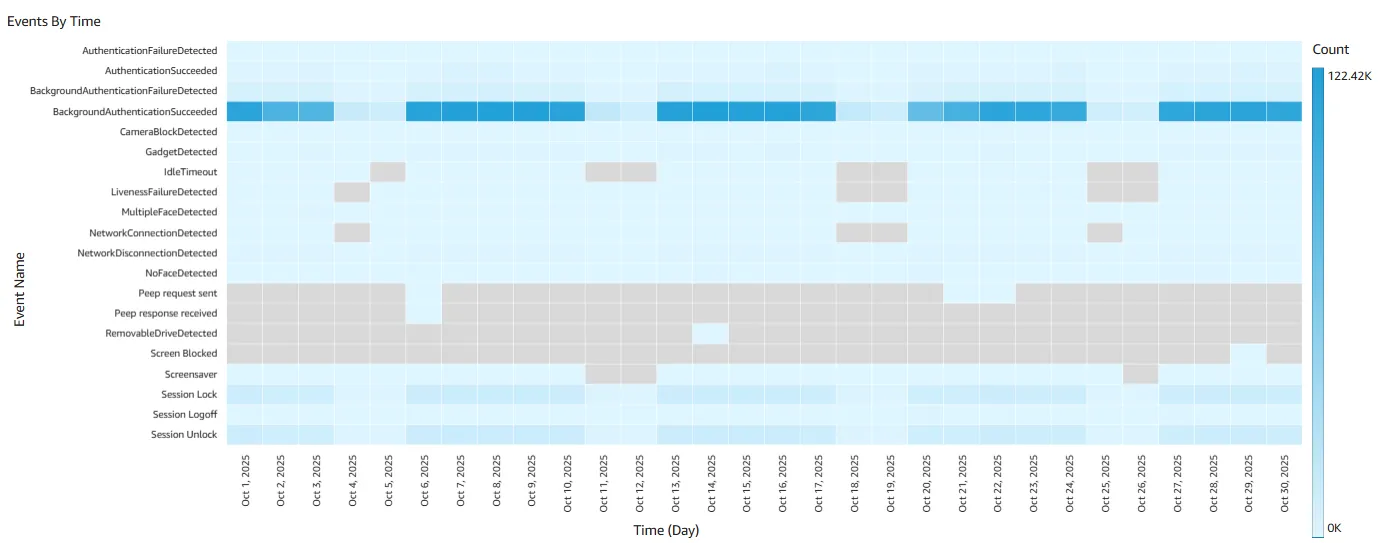
Events by Time is a heat map that displays event counts over time. The default time scale is set to days, with each column representing a specific date.
Uses
This visual helps quickly identify time periods with unusual spikes or patterns in specific event types. The displayed data reflects the filters and values configured in the Common Controls.
Drill-downs Supported
- Cell Drill Down - The Event Name and the date/time are passed as filters to the following visuals on this tab.
- Events By Agents - This visual will be updated to show all occurrences of the event on the selected time, showing the Top 50 agents with the most occurrences.
- Time Drill Up/Down - Time-based drill-ups and drill-downs can be accessed via the visual menu located in the top-right corner of the chart.
Tooltips
Tooltips are shown when the cursor is placed on any cell. The information shown includes;
- Date - Date of the event
- Event Name - Showing the name of the event.
- Team - Team name. If multiple teams, then a '*' is shown
- Supervisor - Name of the supervisor. If multiple supervisors, then a '*' is shown
- Agents - Name of the agent. If multiple agents, then a '*' is shown
- Count - Count of events in the selected time period
💡 Tip: Since drill-downs filter data across visuals, tooltips help clarify the specific details being displayed.
📅 Visual: Events By Agent (Top 50)
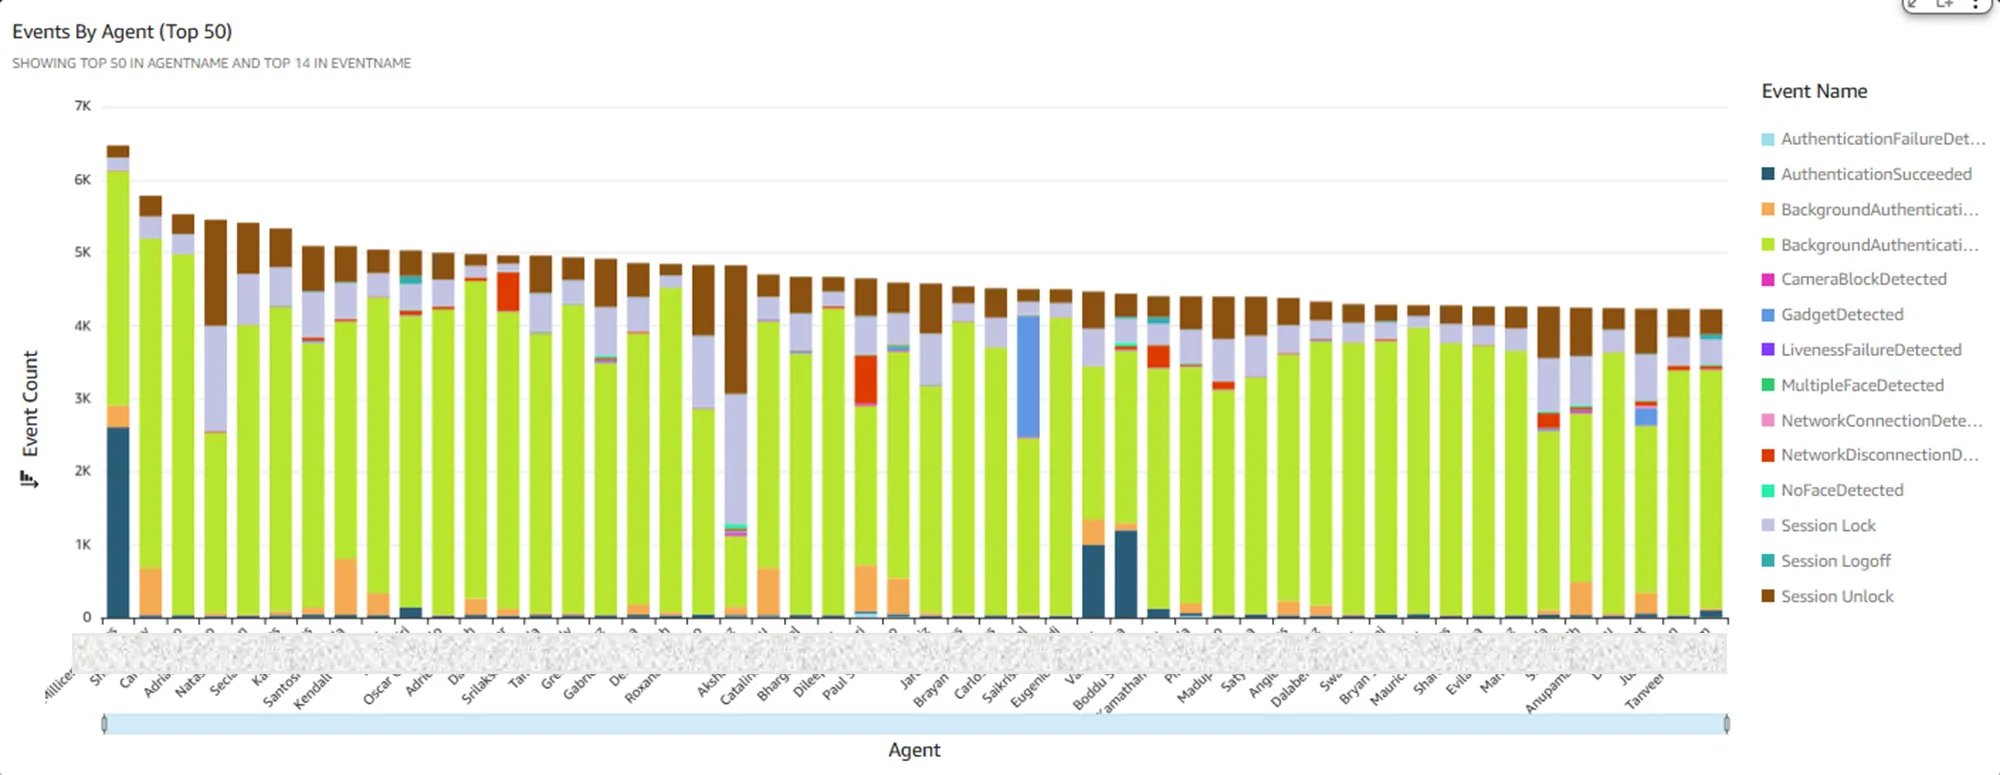
Events by Agent displays a stacked bar chart showing event counts for agents within the selected time period. If more than 50 agents are selected, only the top 50—based on total event count—are shown. Each bar represents the total number of events for a specific agent, with individual segments color-coded by event type. The length of each segment reflects the count of that event type, and the legend provides a color reference for all event categories.
Uses
This visual helps identify unusual event counts for individual agents. For example, does an agent have an unexpectedly high number of NetworkDisconnected events or frequent BackgroundAuthentication failures? The chart displays event counts only—it does not reflect the duration of each event. As such, it’s useful for spotting potential issues in an agent’s environment, but it should not be used to assess productivity.
Drill-downs Supported
- Agent Drill Down - Clicking on any part of a bar on the chart passes the agent name as a filter to the following visuals on this tab.
- Events By Time - The visual is filtered to display only the events associated with the selected agent and time period. Tooltips reveal the agent’s name for each cell.
- Face Auth Success Ratio - The visual is filtered to show the overall Face Authentication success ratio for the selected agent and time period. Tooltips display the agent’s name.
- Reviewed Events % - This visual is filtered to display reviewed events for the selected agent and time period. Tooltips reveal the agent’s name for each data point.
Tooltips
Tooltips are shown when the cursor is placed on any segment of the bar. The information shown includes;
- Name - Agent name represented by the bar
- Event Name - Showing the name of the event
- Count - Count of events in the selected time period
- Last Event - Shows the last time of occurrence of the event
💡 Tip: Since drill-downs filter data across visuals, tooltips help clarify the specific details being displayed.
📅 Visual: Face Auth Success Ratio
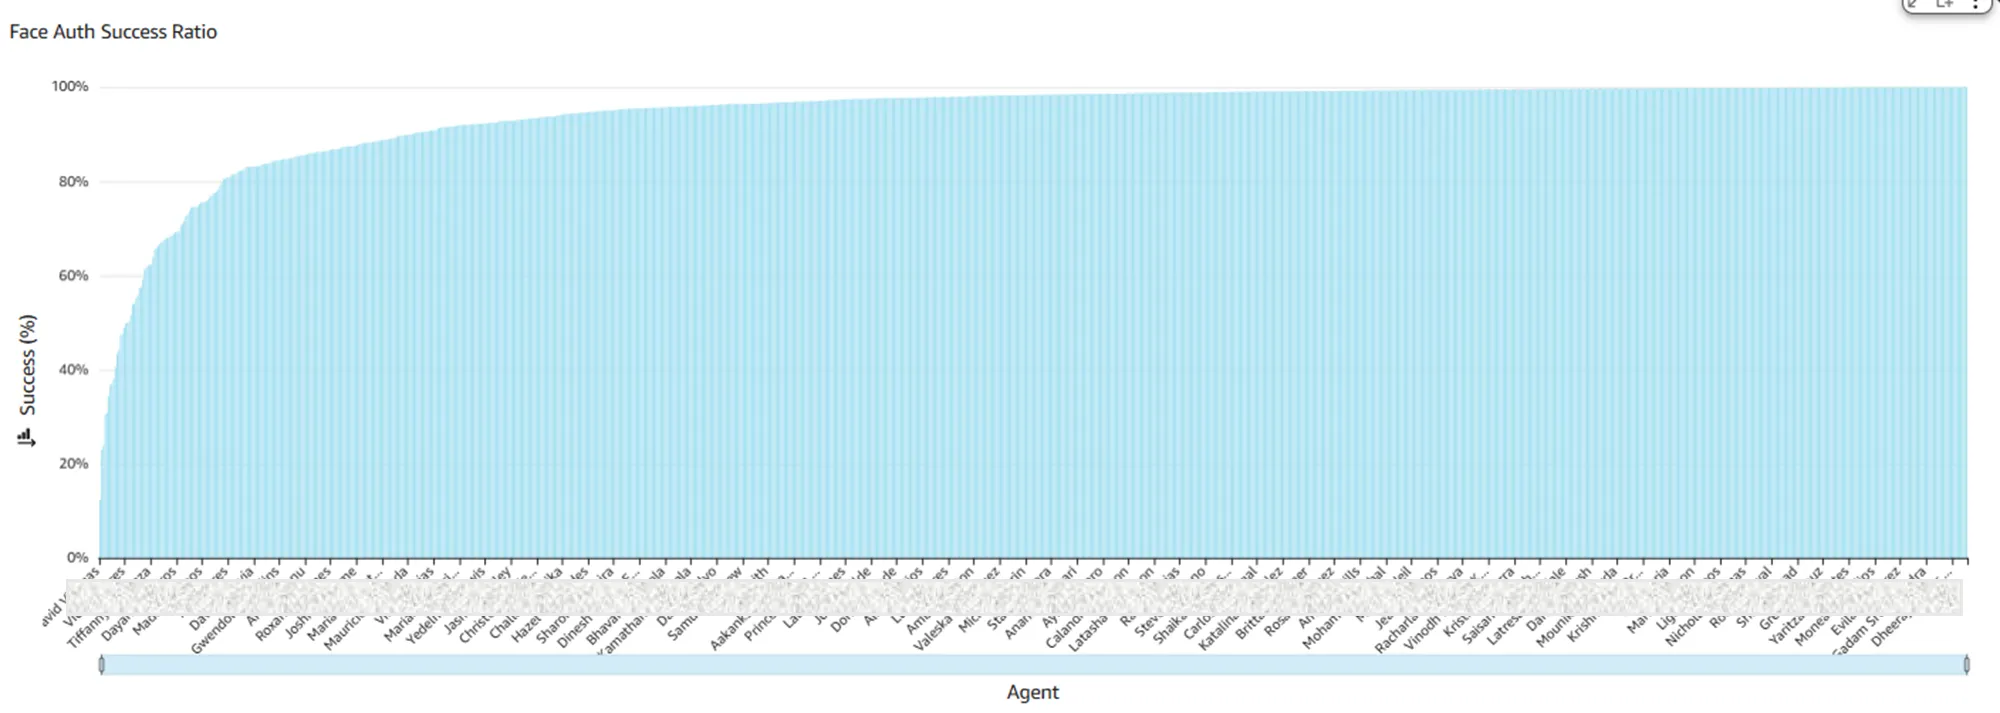
Face Auth Success Ratio displays bars representing the percentage of successful Face Authentication attempts relative to the total attempts. Each bar reflects the average success ratio for an agent over the selected time period. When multiple agents are selected, the chart prioritizes those with the lowest success ratios, showing only the subset that fits within the visual space.
Uses
This chart helps quickly identify agents who may need support with camera positioning, lighting, or their physical environment. A Face Authentication success ratio below 75% may warrant further review. Note that the chart reflects success ratios only—it does not indicate the total number of authentication attempts.
Drill-downs Supported
- Agent Drill Down - Clicking on a bar on the chart passes the agent name as a filter to the following visuals on this tab.
- Events By Time - The visual is filtered to display only the events associated with the selected agent and time period. Tooltips reveal the agent’s name for each cell.
- Events By Agents - This visual is filtered to display all events associated with the selected agent during the chosen time period. Tooltips reveal the agent’s name and the timestamp of the most recent occurrence for each event type.
- Reviewed Events % - This visual is filtered to display reviewed events for the selected/ agent and time period. Tooltips reveal the agent’s name for each data point.
Tooltips
Tooltips are shown when the cursor is placed on any bar. The information shown includes;
- Name - Agent name represented by the bar
- Face Auth Success Ratio - Value of the success in percentage
- Team - Team name. If multiple teams, then a '*' is shown
- Supervisor - Name of the supervisor. If multiple supervisors, then a '*' is shown
- Last Event - Shows the last time of occurrence of the event
💡 Tip: Since drill-downs filter data across visuals, tooltips help clarify the specific details being displayed.
📅 Visual: Reviewed Events %
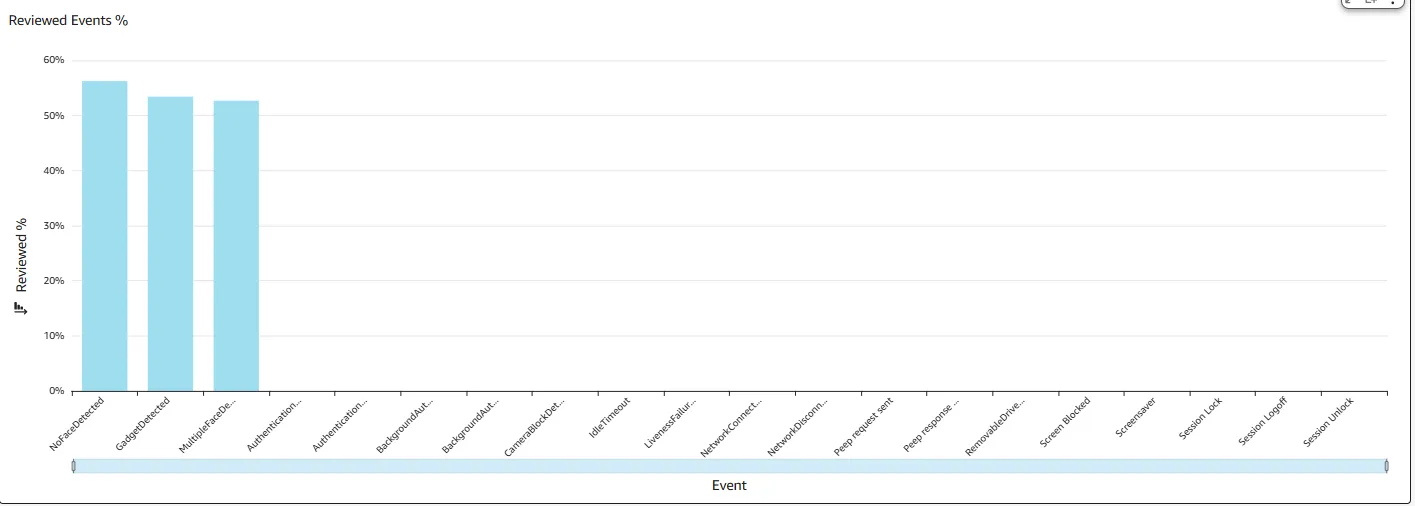
Each event in Secure Work can be reviewed and marked as either Accepted or Rejected. The Reviewed Events % visual displays bars representing the percentage of reviewed events for each category, in the selected time period, and for the selected agents. If no bar is shown for a particular event type, it indicates that none of the events in that category were reviewed. Each bar corresponds to a specific event type.
Uses
This chart indicates the proportion of events that have been reviewed. It helps assess whether the current review volume is sufficient or if adjustments are needed to support effective operations.
Drill-downs Supported
- Event Drill Down - Clicking on a bar on the chart passes the event as a filter to the following visuals on this tab.
- Events By Time - The visual is filtered to display only the event for the selected time period. Tooltips reveal the agent, supervisor, and team names.
- Events By Agents - The visual is filtered to display only the event for the selected agents during the chosen time period. Tooltips reveal the agent’s name and the timestamp of the most recent occurrence for each event type.
Tooltips
Tooltips are shown when the cursor is placed on any bar. The information shown includes;
- Event Reviewed % - Value in percentage of events reviewed
- Team - Team name. If multiple teams, then a '*' is shown
- Supervisor - Name of the supervisor. If multiple supervisors, then a '*' is shown
- Agents - Name of the agent. If multiple agents, then a '*' is shown
- Last Event - Shows the last time of occurrence of the event
💡 Tip: Since drill-downs filter data across visuals, tooltips help clarify the specific details being displayed.