Drilldown Tab
The Drilldown tab provides a detailed, event-level view of application usage, with a particular focus on unproductive activity. It complements the high-level patterns shown in the Insights tab by surfacing granular records that enable deeper investigation into individual agent behavior and specific application sessions. Visuals in this tab include breakdowns of unproductive usage by agent and application, as well as table views that list each usage event chronologically. These details support targeted analysis, helping supervisors identify recurring inefficiencies, monitor compliance, and guide coaching efforts. Filters and drilldowns allow users to isolate specific teams, agents, timeframes, or application categories for focused review.
📅 Visual: Unproductive App Usage
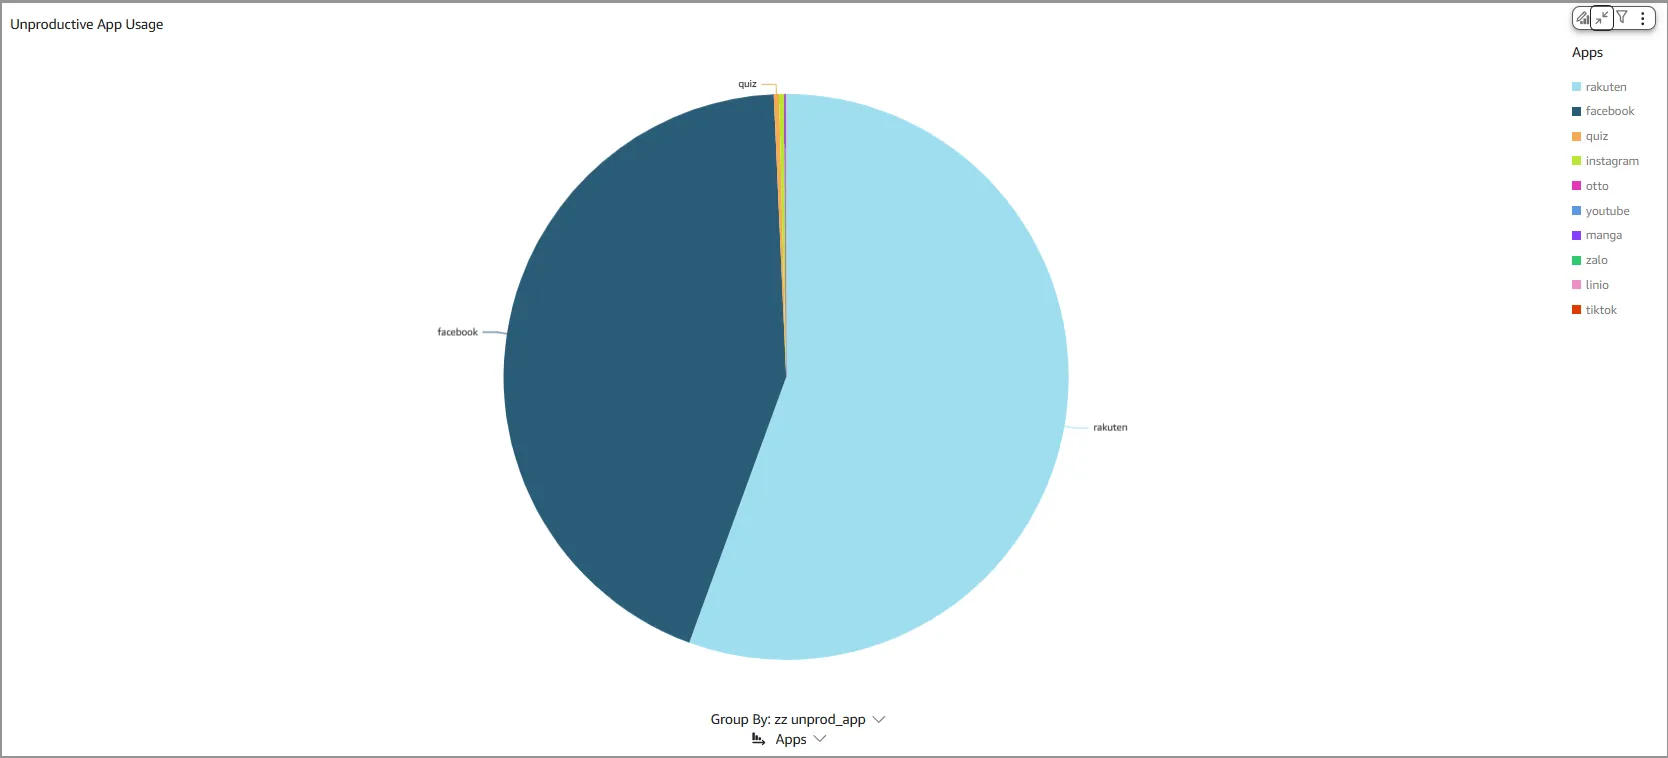
The Unproductive App Usage pie chart displays the total unproductive application usage segmented by individual contributors to unproductive usage. The data is aggregated based on the selected teams and time period in Common Controls.
Uses
This pie chart provides a quick visual breakdown of unproductive app usage. Use the Common Controls to narrow the view to specific teams or to specific periods of time for deeper insights.
Drill-downs Supported
- Unproductive Usage Drill Down - The unproductive usage is passed as a filter to the following visuals on this tab.
- Top Usage of Apps by Agents - This table visual is updated to show details for the selected unproductive usage.
- App Usage Details - This table visual is updated to show details for the selected unproductive usage.
Tooltips
Tooltips are shown when the cursor is placed on any segment of the pie chart. The information shown includes;
- Unproductive Usage - Show the contributor to unproductive usage
- Time (s)- Total time for the category
- Team - Team name. If multiple teams, then a '*' is shown
- Agent - Agent name. If multiple agents, then a '*' is shown
- Last Event - Shows the last time of occurrence of the event
💡 Tip: Since drill-downs filter data across visuals, tooltips help clarify the specific details being displayed.
📅 Visual: Top Usage of Apps by Agents
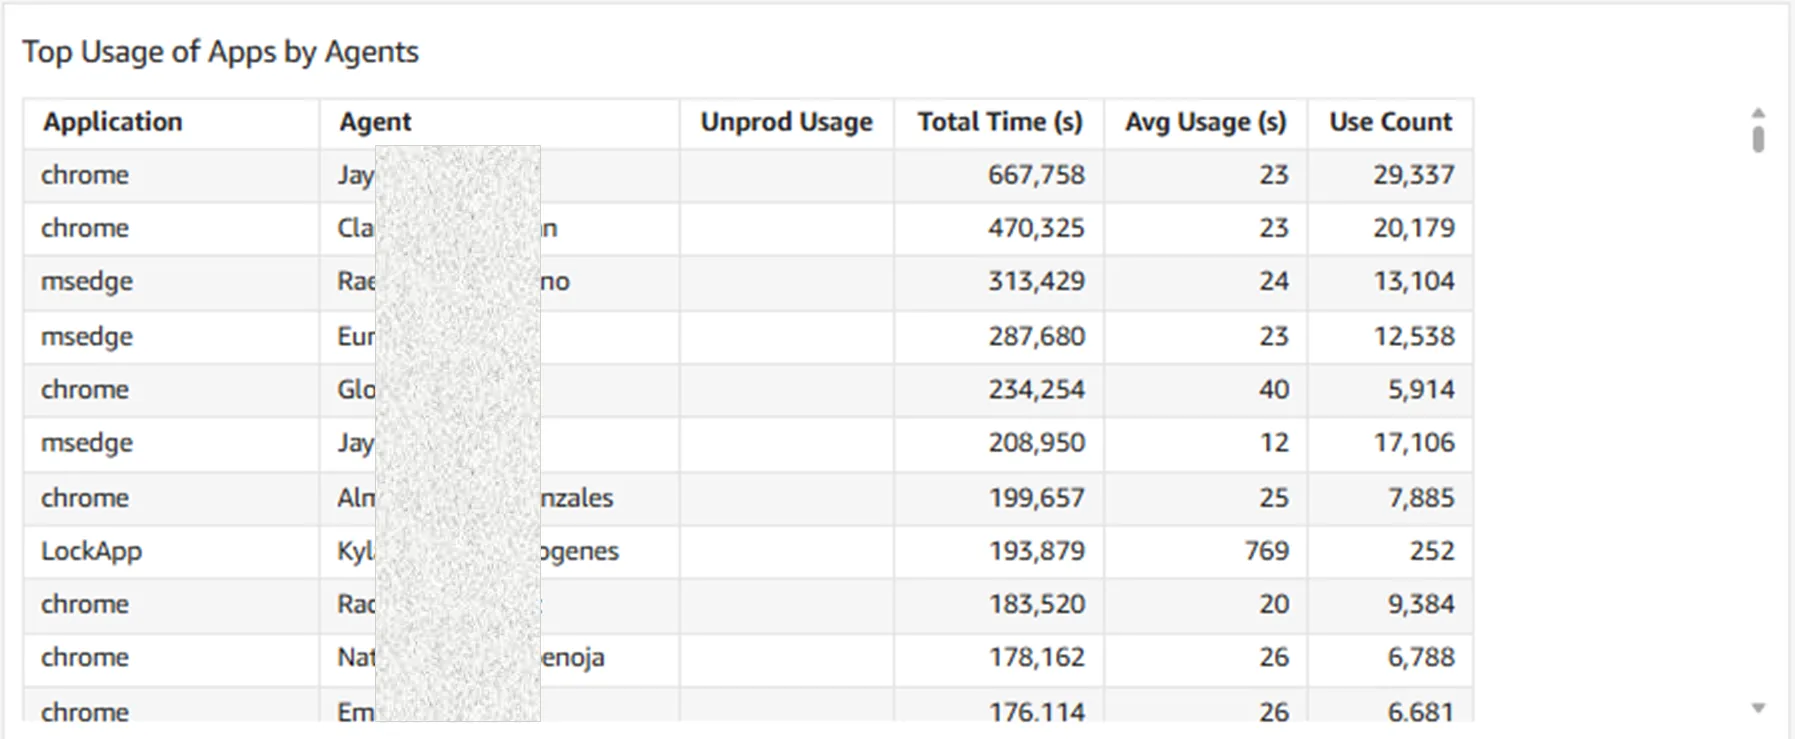
Top Usage of Apps by Agents visual highlights the most frequently used applications across agents. It provides detailed metrics, including total usage time, average usage per instance, and the number of times each application was accessed. The data is aggregated based on the selected teams and time period defined in Common Controls.
The table has the following columns:
- Application - Name of the application
- Agent - Name of the agent
- Unprod Usage - Contributor to unproductive use. This is the name of the application or page that is marked as unproductive. Empty cells signify productive usage.
- Total Time (s) - Total usage for that application and usage type aggregated for the selection in Common Controls.
- Avg Usage (s) - Average usage for that application and usage type aggregated for the selection in Common Controls.
- Use Count - Count of the times this application with this usage type was accessed, aggregated for the selection Common Controls
Uses
This visual offers deeper insight into how agents interact with various applications, helping uncover usage patterns and identify potential areas for optimization.
Drill-downs Supported
- Row detail Drill Down - The agent name, application, and usage type are passed as filters to the following visuals on this tab.
- Unproductive App Usage - The pie chart is filtered by the agent, application, and usage type.
- App Usage Details - This table visual is updated to show details for the selected agent, application, and usage type.
Tooltips
Tooltips do not apply to table visuals
💡 Tip: Data from the table can be exported into CSV or Excel files. Note: exports are limited to 100,000 rows.
📅 Visual: App Usage Details
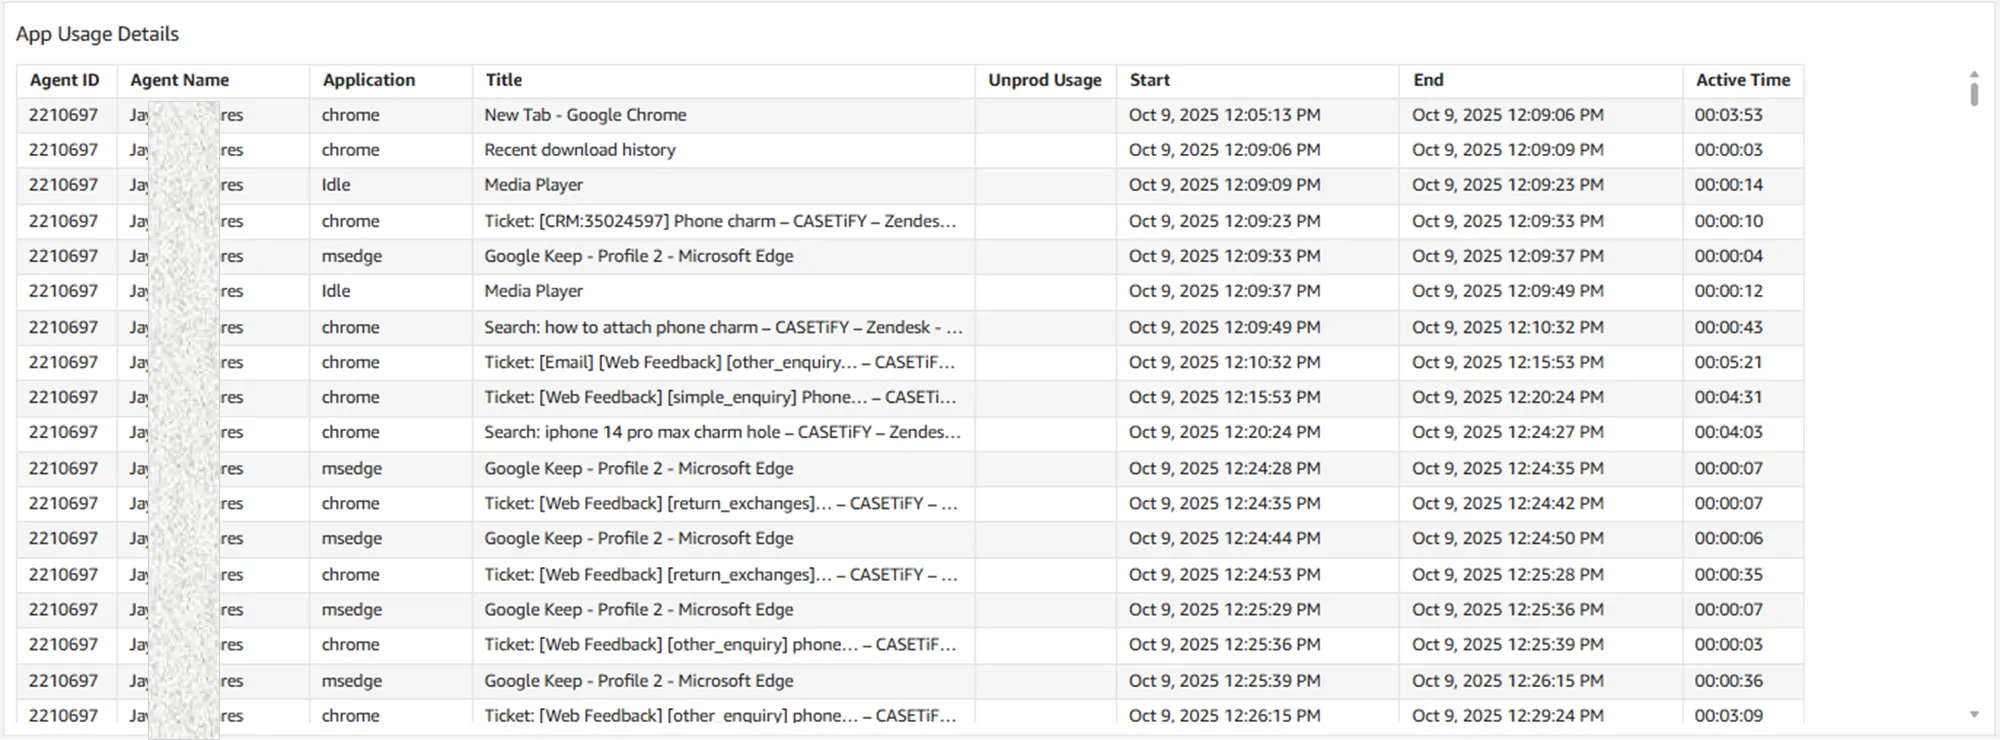
App Usage Details table visual presents detailed records of each instance of application usage by agents, organized chronologically. The data is aggregated according to the selected teams and time period specified in Common Controls, enabling focused analysis of individual activity over time.
The table has the following columns:
- Agent ID - The configured Agent ID
- Agent Name - Name of the agent
- Application - Name of the application
- Title – The name displayed in the application's window title bar.
- Unprod Usage - Contributor to unproductive use. This is the name of the application or page that is marked as unproductive. Empty cells signify productive usage.
- Start - Time when this instance of application usage started.
- End - Time when this instance of application usage ended.
- Active Time – The total duration the application was actively used during this specific instance.
Uses
This visual helps track individual instances of application usage, offering a detailed view of how agents interact with specific tools. By referencing the application's window title bar, supervisors can gain additional context into the agent’s activity during each session.
Drill-downs Supported
No drill downs are available from this visual.
Tooltips
Tooltips do not apply to table visuals
💡 Tip: Data from the table can be exported into CSV or Excel files. Note: exports are limited to 100,000 rows.