DPA Dashboard
Tetherfi Secure Work tracks application usage on a PC, recording the time spent on each application. Each usage session is further classified as either productive or unproductive. The DPA Dashboard aggregates this data to provide insights into agent activity across teams and time periods. This page outlines the dashboard’s layout, filtering options, available tabs, and the visuals contained within each tab.
🧭 Access & Navigation
The dashboard is accessible via an Amazon QuickSight account. Users will be invited to create an account, and upon account creation, the appropriate dashboards will be accessible.
From the QuickSight Homepage Dashboards menu, users can select the “DPA Dashboard” from the list of available dashboards.
Standard dashboard controls are available from the top-right icons. Key controls are:
- Export options (PDF, print)
- Sharing (limited to pre-shared users)
- AI-powered query suggestion

🛠️ Common Controls
Located at the top of the tab, the controls panel allows users to customize the data for all visuals in the tab:
- Period – Select the time period for analysis.
- Team – Select a team for analysis.
- App Category – Show all usage types or choose to show on productive or unproductive usage.
- GMT Offset – Adjust the time zone to match your local context.
These controls and filters apply across all visuals and dynamically update the dashboard content.

🧩 Common Menus in Visuals
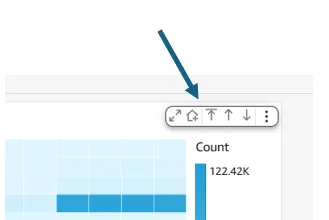
Each visual includes a menu located in the top-right corner for additional controls.

Dashboard visuals are organized into dedicated tabs, each grouping related insights for easier navigation. This dashboard includes the following tabs
Insights Tab - The Insights tab presents high-level, aggregated views of application usage across teams and time periods. These visuals highlight patterns in productivity, helping identify trends, outliers, and overall usage distribution. The tab contains the following visuals:
Drilldown Tab - The Drilldown tab focuses on detailed records of unproductive application usage. It includes granular table visuals that capture individual usage events, enabling deeper analysis at the agent and application level. The tab contains the following visuals: