Productivity Tab
Productivity
Secure Work captures a timestamp for every event that occurs. The time following each event is classified as either productive or unproductive, depending on the event type. For example, time after an AuthenticationSucceeded event is considered productive, while time following a Session Lock event is marked as unproductive. The following events are categorized as unproductive:
- NoFaceDetected
- Session Lock
- Session Logoff
- Screen Blocked
- CameraBlockDetected
- NetworkDisconnectionDetected
This tab’s visuals highlight patterns of productive and unproductive time across selected agents within the chosen timeframe.
📅 Visual: Logged in Agent Count
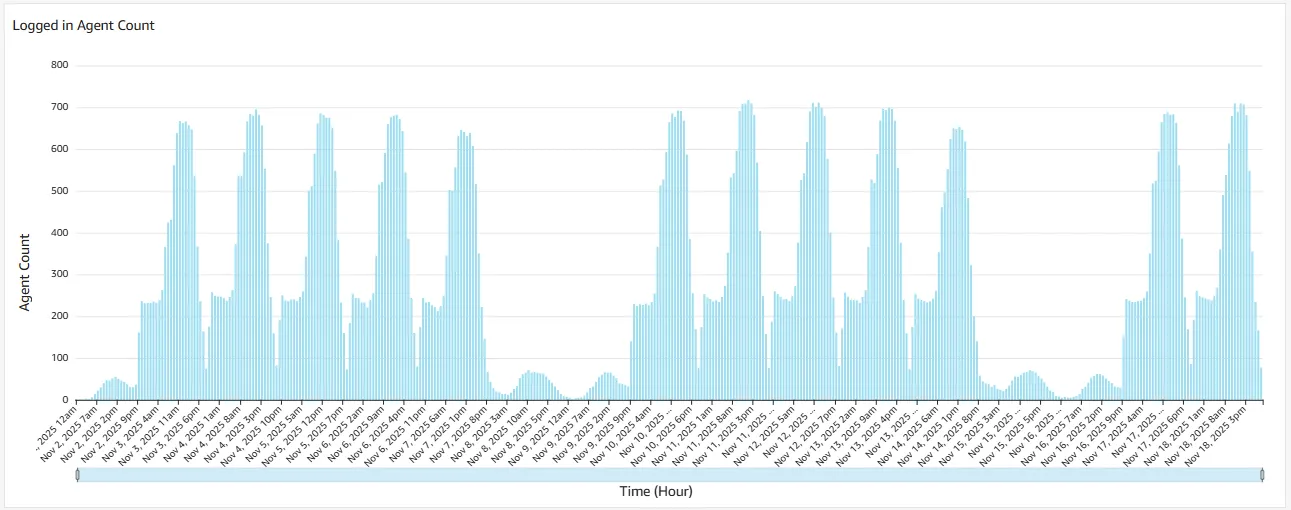
Logged in Agent Count visual displays the number of agents logged in across selected teams during the chosen time period. By default, the chart presents one bar per hour, but the time aggregation can be adjusted as needed using the Common Menus in the top-right corner.
Uses
The Logged in Agent Count visual provides a clear view of the number of agents active across selected teams during a chosen time frame. It helps supervisors monitor workforce availability, identify peak activity periods, and adjust staffing to ensure balanced coverage.
Drill-downs Supported
- Period Drill Down - Selecting a bar in this chart triggers a time-based filter that updates the other visuals on the tab accordingly.
- Active Agents in Teams - This table shows active agents per team, filtered by the time period associated with the selected bar.
- Total Daily Productive vs Unproductive Time - The visual is filtered to show productive vs unproductive time for the selected time period.
- Total Agent Productive vs Unproductive Time - The visual is filtered to show each team's productive vs unproductive time, filtered by the time period associated with the selected bar.
- Event Details - Filtered by the time period of the selected bar, this table presents agent event details in chronological order across all selected teams.
- Time Drill Up/Down - Time-based drill-ups and drill-downs can be accessed via the visual menu located in the top-right corner of the chart.
Tooltips
Tooltips are shown when the cursor is placed on any bar. The information shown includes;
- Time - Time for the agent count
- Team - Team name. If multiple teams, then a '*' is shown
- Agents - Name of the agent. If multiple agents, then a '*' is shown
- Count - Count of the agents
💡 Tip: Since drill-downs filter data across visuals, tooltips help clarify the specific details being displayed.
📅 Visual: Active Agents in Teams
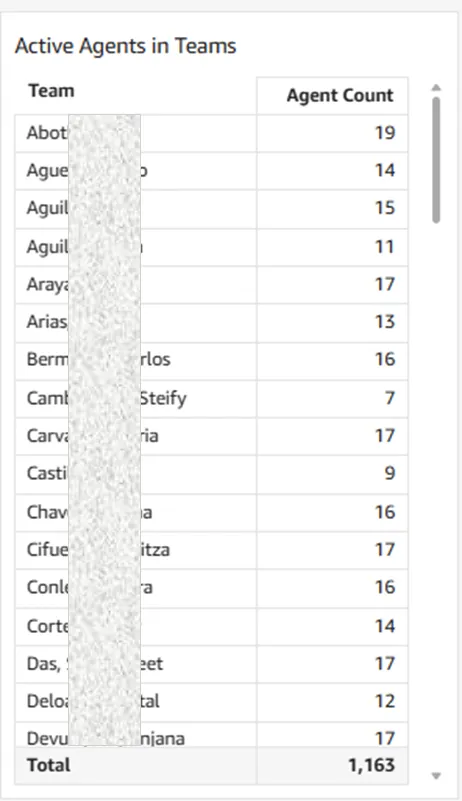
Active Agents in Teams visual is a table visual that shows the count of agents who have logged in during the selected time period. The table has the following columns:
- Team - The name of the team
- Agent Count - Count of agents who have logged in during the selected period.
Uses
This table provides the number of active agents in each team for the selected time period.
Drill-downs Supported
- Team Drill Down - Selecting a cell applies the team name as a filter to the other visuals on this tab.
- Logged in Agent Count - The visual is filtered to display the count for the selected team and timeframe, with tooltips showing the team, agent, and count.
- Total Daily Productive vs Unproductive Time - The visual is filtered to show events for the selected team and timeframe, with tooltips showing the team, supervisor, and agent.
- Total Agent Productive vs Unproductive Time - The visual is filtered to show data for all agents in the selected team and timeframe, with tooltips showing the team, supervisor, and agent.
- Event Details - This table visual shows events for the selected team.
Tooltips
Tooltips do not apply to table visuals.
📅 Visual: Total Daily Productive vs Unproductive Time
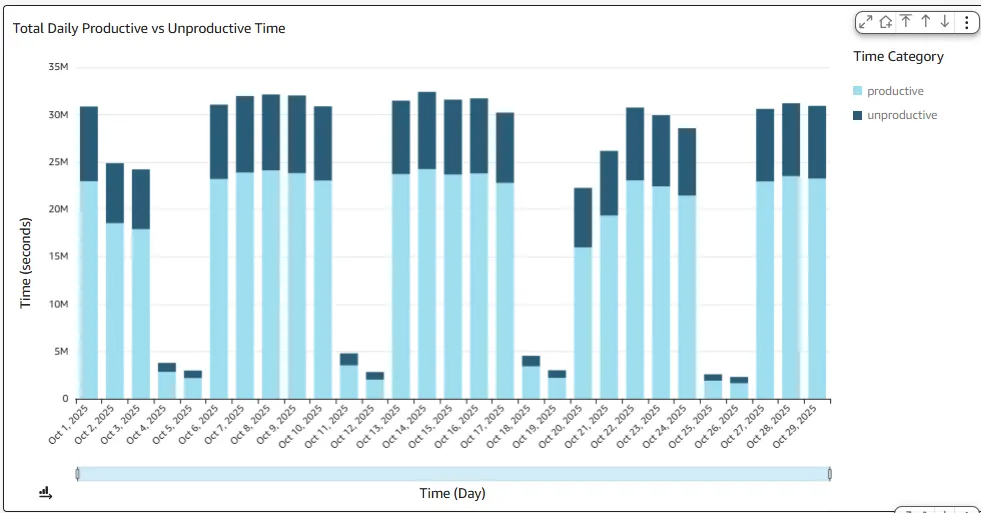
Total Daily Productive vs Unproductive Time stacked chart displays, by default, each day's productive and unproductive time as separate segments within each bar. The Common Controls of the tab define the selected teams, event types, and time period. The chart’s bars denote individual time periods, with bar height representing the cumulative time for each time category.
Uses
Aggregated over the selected period, this chart compares productive and unproductive time. Disproportionately high unproductive time on certain days may signal the need for targeted drilldown analysis.
Drill-downs Supported
- Period Drill Down - Selecting a bar in this chart triggers a time-based filter that updates the other visuals on the tab accordingly.
- Logged in Agent Count - The visual is filtered to display the count for the selected period, with tooltips showing the team, agent, and count
- Active Agents in Teams - This table shows active agents per team, filtered by the time period associated with the selected bar.
- Total Agent Productive vs Unproductive Time - The visual is filtered to show each team's productive vs unproductive time, filtered by the time period associated with the selected bar.
- Event Details - Filtered by the time period of the selected bar, this table presents agent event details in chronological order across all selected teams.
- Time Drill Up/Down - Time-based drill-ups and drill-downs can be accessed via the visual menu located in the top-right corner of the chart.
Tooltips
Tooltips are shown when the cursor is placed on any segment of the bar. The information shown includes;
- Date - Date of the events
- Productivity type - Shows the category of the time represented by the segment of the bar
- Total time(s) - Total time for the productivity type, in seconds, for the selected period of the bar
- Team - Team name. If multiple teams, then a '*' is shown
- Supervisor - Name of the supervisor. If multiple supervisors, then a '*' is shown
- Agents - Name of the agent. If multiple agents, then a '*' is shown
💡 Tip: Since drill-downs filter data across visuals, tooltips help clarify the specific details being displayed.
📅 Visual: Total Agent Productive vs Unproductive Time
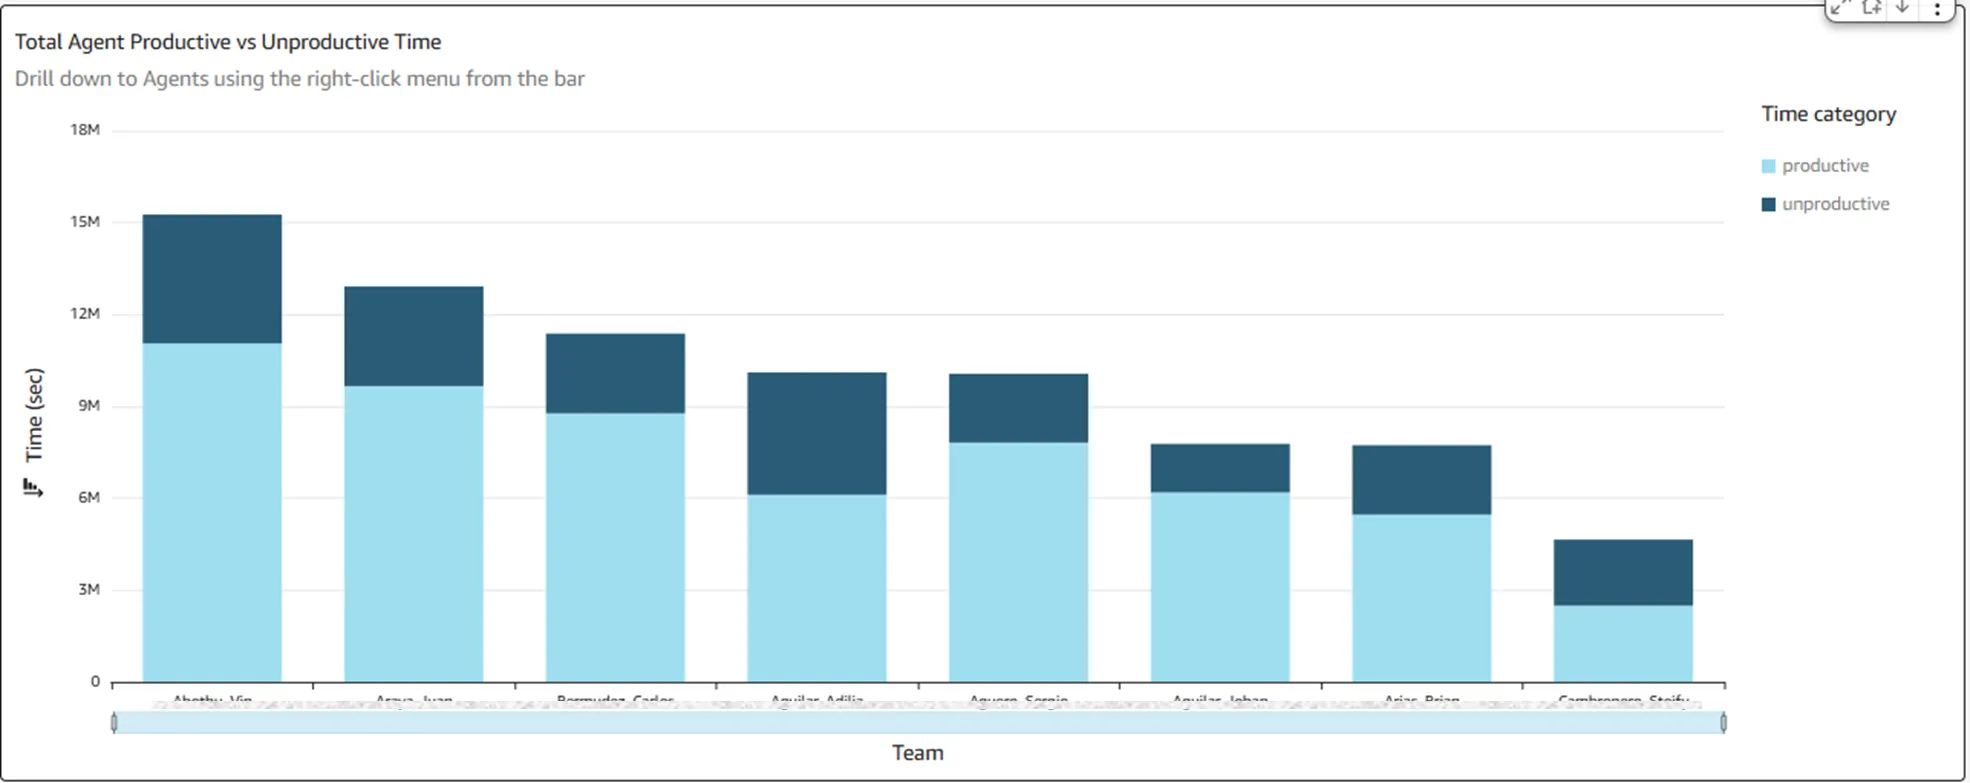
By default, this stacked chart displays the total productive versus unproductive time for each selected team within the defined time period. Each bar represents one team’s time breakdown. The selected teams, event types, and time period are configured through the tab’s Common Controls.
Agent Drill Down - This visual supports drilldowns to agent-level usage details. Right-clicking a bar opens a menu with the option to drill down to agents in the team.
Uses
This visual provides a quick comparison of each team's total time, segmented into productive and unproductive categories. It highlights two key insights: which team has logged the most overall time, and which team demonstrates the highest ratio of productive to unproductive time. Individual agent productivity within each team can be explored further through drilldowns, as mentioned above in Agent Drill Down.
Drill-downs Supported
- Team Drill Down - Selecting a bar in this chart triggers a team or agent filter that updates the other visuals on the tab accordingly.
- Logged in Agent Count - The visual is filtered to display the count for the selected team or agent and timeframe, with tooltips showing the team, agent, and count.
- Active Agents in Teams - This table shows active agents for the selected team or agent, for the selected time period.
- Total Daily Productive vs Unproductive Time - This visual displays the productive versus unproductive time for the selected team or agent, filtered by each date for the chosen time aggregation period.
- Event Details - Filtered by the team or agent, this table presents event details in chronological order across the selected time period.
Tooltips
Tooltips are shown when the cursor is placed on any segment of the bar. The information shown includes;
- Team - Name of the team
- Productivity type - Shows the category of the time represented by the segment of the bar
- Total time(s) - Total time for the productivity type, in seconds, for the selected period of the bar
- Team - Team name. If multiple teams, then a '*' is shown
- Supervisor - Name of the supervisor. If multiple supervisors, then a '*' is shown
- Last Event - Shows the last time of occurrence of the event of that type
💡 Tip: Since drill-downs filter data across visuals, tooltips help clarify the specific details being displayed.
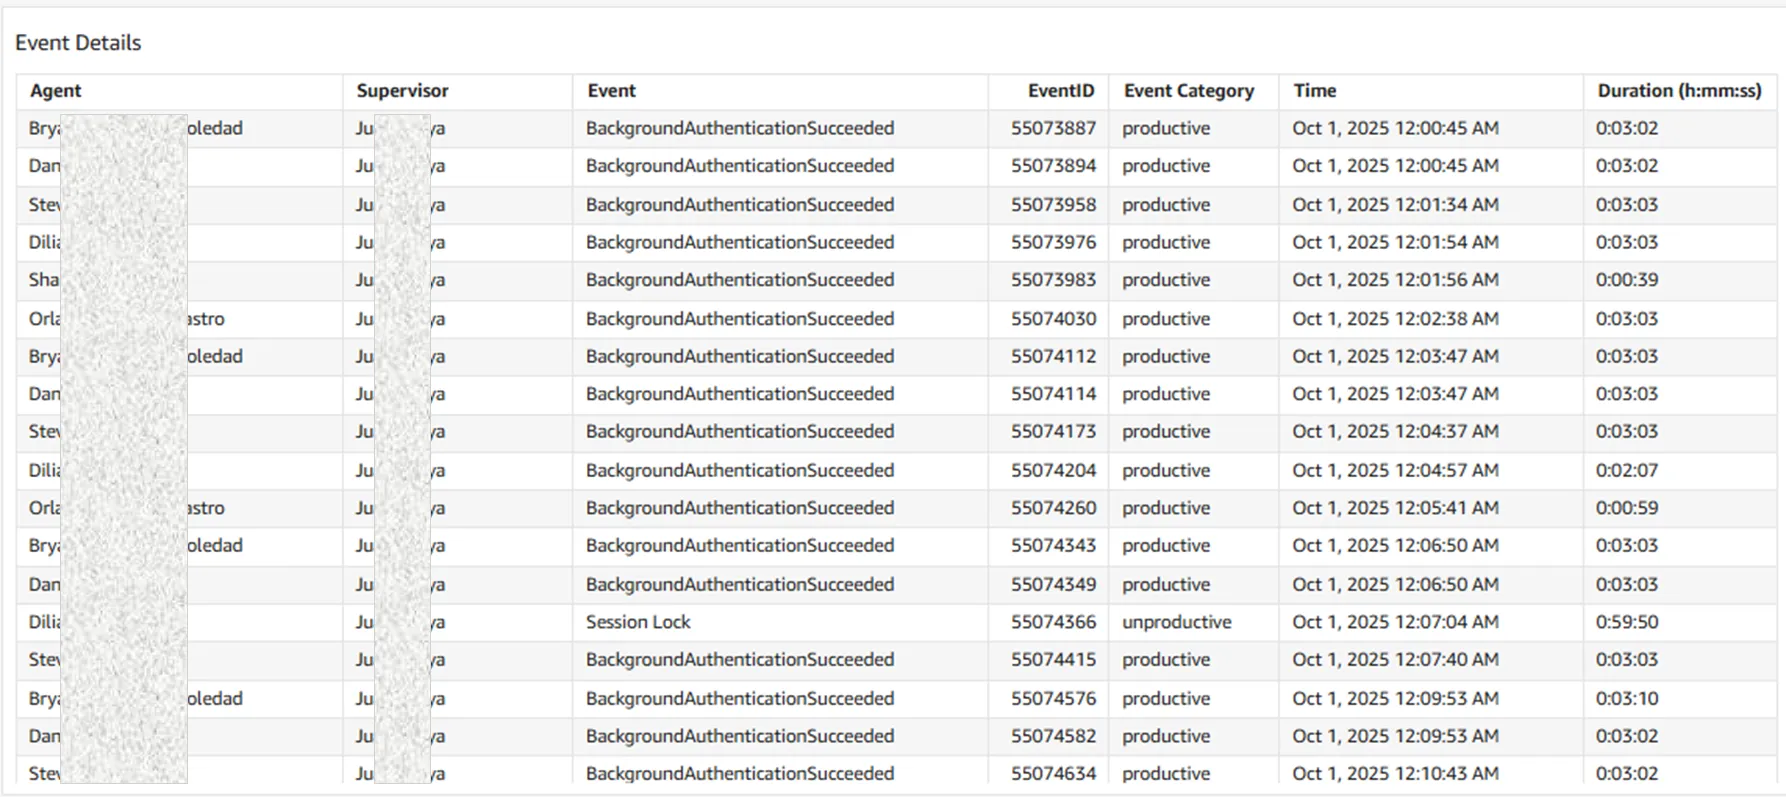
📅 Visual: Event Details
Event Details visual is a table showing the details for each event. The following columns are shown:
- Agent - The name of the agent
- Supervisor - The name of agent's supervisor
- Event Name - The name of the rejected event
- Event ID - The event ID using which details of this event can be seen in OCM
- Event Category - The type is indicated as 'productive' or 'unproductive'
- Time - Time at which this event occurred
- Duration - Indicates the duration of the event, defined as the time between this event and the subsequent event.
Uses
This visual displays the chronological sequence of events for the selected time period and agents. The table includes key details—such as the Event ID—which can be used to access the full event record in OCM for further review.
💡 Tip: Event details can be exported as a CSV or Excel file using the menu located in the top-right corner of the visual. Note: exports are limited to 100,000 rows.
Drill-downs Supported
- Agent Drill Down - Clicking on any cell in the table will pass the agent name as a filter to the following visuals on this tab.
- Logged in Agent Count - The visual is filtered to display the count for the selected agent and timeframe, with tooltips showing the team, agent, and count.
- Total Daily Productive vs Unproductive Time - The visual is filtered to display only the events for the selected agent. Tooltips reveal the agent’s name on each bar.
- Total Agent Productive vs Unproductive Time - The visual is filtered for the selected agent and for the selected time period.
Tooltips
Tooltips do not apply to table visuals.